 Digressive Celts
Season Forecasting
How we forecast the rest of the season using team ratings, squad values, and 10,000 simulations.
By Larry Nerd
We have plenty of good ways to put a number on how good a team is. With this, we can have a pretty good guess at how likely two teams facing off are to win. Since we can do that for one game, we can work our way through a full season estimating results to get an idea of what might happen by the end. If we work our way through a season like that thousands of times, we end up with a fairly good idea of how likely different things are to happen. That’s the core idea behind our season forecasting.
There are a few things that tell us how good a team might be. Their past performances, in both actuality and expected; what tends to happen in the league; how valuable their squad is. We combine all of them into two ratings for each team.
The first gives each team two numbers: an attack rating, for how many goals it tends to create, and a defence rating, for how many it tends to concede. We learn them from every league match, weighted by the opposition: scoring twice against Celtic counts for more than scoring twice against the bottom side.
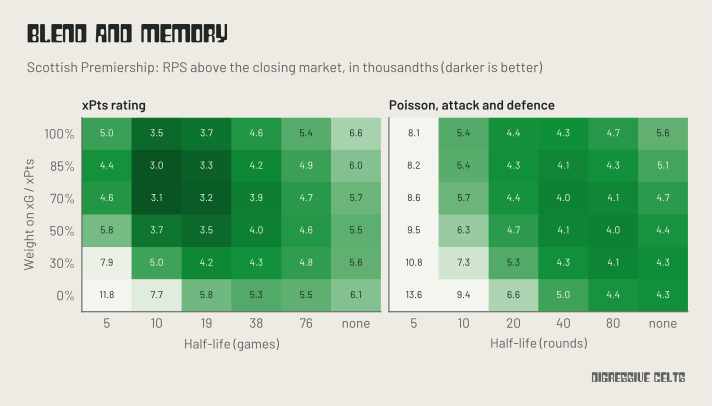
A team’s ‘goals’ here are a blend of 70% Expected Goals and 30% Actual Goals. That split is a common choice, and our testing supported it: anything from 70% to 85% expected worked best, leaning entirely on Actual Goals was clearly worse (Appendix B). Expected Goals stabilise more quickly, but Actual Goals may carry some things that xG models aren’t perfectly calibrated on.
Recent matches count for more than old ones. A match from 20 rounds ago counts half as much as the most recent, and one from 40 rounds ago a quarter. The summer break is excluded.
The second rating is the Expected Points rating: a running average of a team’s Expected Points (85%) and Actual Points (15%) per game, where each game counts for marginally less than the one after it (at a rate that corresponds with halving every ten games). It forgets faster than the first rating, so picks up changes in form sooner, so is particularly useful early in the season.
Both ratings start each season from the value of the squad, using Transfermarkt’s valuations. Squad value is a decent summary of what a club has spent and what a number of people think of their players. Crowd valuations like this have a good track record in forecasting [1]. We lean on this more early in the season in lieu of actual evidence of how good the team will be that season. As more matches are played, and we can observe how good the team actually is, the squad value matters less and less.
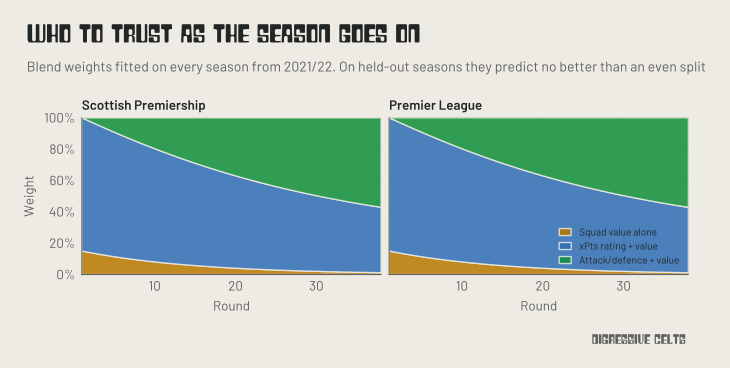
Finally, we blend the two ratings evenly. We tested letting the faster rating carry more weight early in the season and less later on, but it didn’t beat a simple 50/50 split (Appendix D).
With this, we can estimate what is likely to happen when two teams play each other. We know the shape of what roughly happens thanks to decades of work on how goals are scored.
Goals are rare and fairly random, so the number a team scores in a match follows a well-known pattern called the Poisson distribution [2]. When given the number of goals a team is expected to score in a particular match (from its attack, the opponent’s defence, and home advantage) it tells you the chance of that team scoring different numbers of goals. Done for both teams, you have the chance of every scoreline.
One tweak, from Dixon and Coles [3], adjusts the low-scoring results (0–0, 1–0, 0–1, and 1–1) slightly to match how often they actually happen.
Here’s how that looks for an actual game:
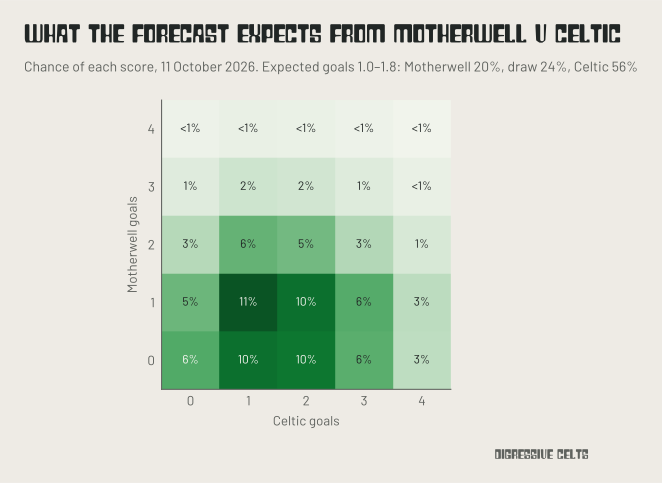
In this case, Celtic are expected to score 1.8 goals to Motherwell’s 1.0. That gives Celtic a 56% chance of winning, Motherwell 20%, and a draw 24%. The single most likely score is 1–1, but at only 11%. Any one match is very uncertain.
Home advantage is included too. It nearly disappeared in 2020/21, when games were played behind closed doors: home teams won 39% of Scottish Premiership matches that season, against 43–52% in every full season since. That season is given its own home advantage value, so it doesn’t drag the rest down.
How good are these predictions?
The toughest test is the bookmakers.
We compared our forecasts for every Scottish Premiership match since 2021/22 with Pinnacle’s closing odds: the final price before kick-off from a specifically sharp bookmaker. Bookmakers build a margin into their odds, so we removed that proportionally to get the probabilities implied by their odds. Each of our forecasts only used what was known before the match.
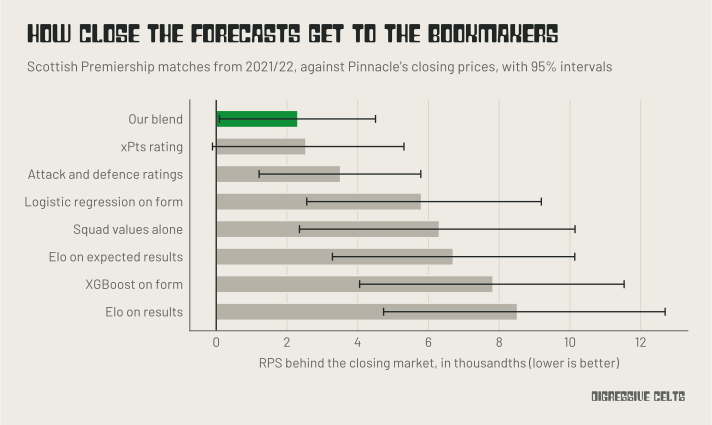
Our blend finished about 0.002 behind the closing prices on the ranked probability score.*
That’s very close. Closing prices are about as good a forecast as exists, as they reflect information from cutting edge models as well as things that are revealed in the lead up to games, like team news and injuries. Elo ratings, a common and simple way of rating teams [4], were 0.007–0.009 behind, and machine learning on recent form 0.006–0.008. Squad values alone, without a single result, managed 0.006 (which is a decent sign that they belong in this conversation).
*The ranked probability score compares the probabilities given to a home win, a draw, and an away win with what happened, giving more credit for being nearly right than entirely wrong [5]. Lower is better. In the Scottish Premiership, the bookmakers’ closing prices score about 0.188 and league averages about 0.231.
Then, we can perform our season simulations. We take every remaining fixture, use the ratings to get the chance of each score, and pick one at random according to those chances. ‘Play’ every match like that, add up the table, and you have one possible end to the season.
Then we do it again, repeatedly (10,000 times), and count. If Celtic finish top in 6,750 of them, their chance of the title is 67.5%. This also tells us the likelihood of finishing in any position, and the range of points each team is likely to end up with.
Two things make this harder than it sounds.
The first is the split. After 33 rounds, the Scottish Premiership splits into a top six and a bottom six, who play each other once more. We don’t know who will be in which half until it happens, so every simulated season splits on its own table and gets its own five extra fixtures.
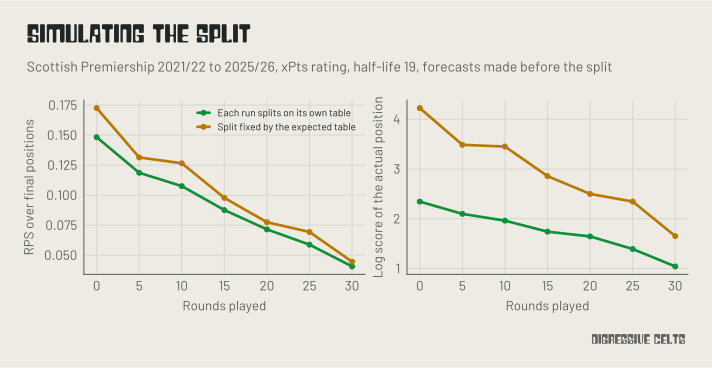
This matters more than is obvious. A common shortcut is to decide the halves in advance from the expected table. That makes it impossible for a team to finish in the other half, which happens to somebody most seasons, and the forecasts get a lot worse (Appendix C).
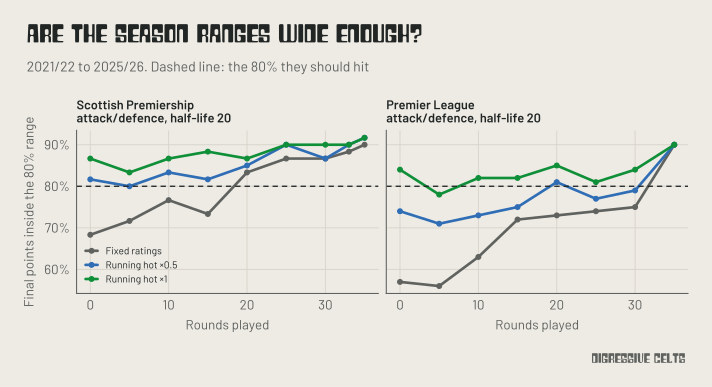
The second is that ratings are an estimate, not a fixed truth. Teams improve and decline, sign players, lose them to injury, and change managers. If every simulated season treats today’s ratings as fixed until May, the forecasts come out too confident.
So, as FiveThirtyEight’s forecasts did previously [6], we let the ratings move within each simulated season. They called this ‘running hot’. After every simulated match, both teams’ ratings shift a little towards the simulated result. A team that goes on a run in one simulated season is rated a bit higher for the rest of that season; a team that collapses, a bit lower. Over 10,000 seasons, that spreads the outcomes out to something closer to how uncertain the future actually is.
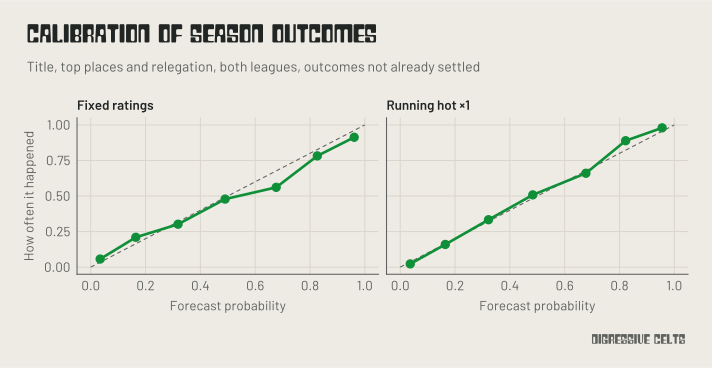
It works well. With fixed ratings, final points finished inside our 80% range only about 70% of the time early in the season. Allowing the ratings to move brought that up to around 80%, where it should be, and made the forecasts more accurate overall.
On the forecasts page, you’ll find each team’s projected points (the average over every simulated season) with the range they ended up in 80% of the time, the chances of the title, a top-six finish, eleventh, and bottom, and a grid with the chance of every finishing position. There’s also a record of how those chances have moved over the season, and the probabilities for the next six matches as things currently stand, with the full schedule and every match’s probabilities on the Matches page.
An important note is that a 30% chance of winning the league isn’t a prediction that a team won’t win it, but an estimation that if the rest of the season was played out 10,000 times, they would win it in 3,000 of them. This shifts throughout the season to reflect new information about what has actually happened. Here is how our forecasts would have seen last season’s title race, using only what was known at each point:
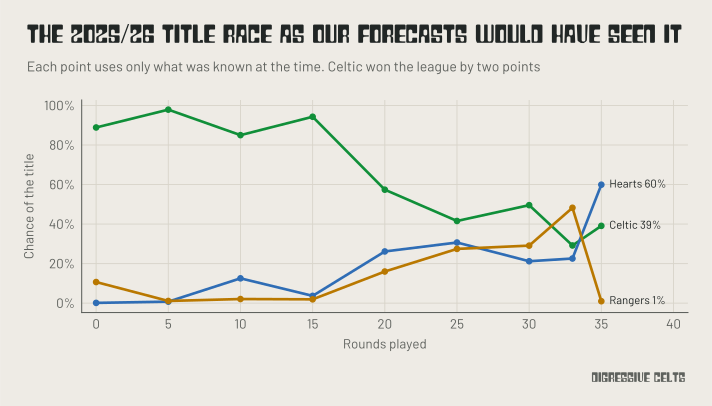
With three rounds left, Hearts were favourites at 60%, and Celtic won it by two points. A 39% chance is not a 0% chance. Across five seasons, the outcomes we gave a given chance happened approximately that often (Appendix C).
There is plenty of information our forecasts do not account for. Injuries, January signings, managerial changes, and tactical shifts only show up once they start affecting results.
Probabilities and predictions are not the same thing. Trying to guess exactly what will happen is a fool’s errand because football and its fine margins throw up shocks all the time. Celtic can still lose the league from a 70% probability. However, our model is calibrated so that we know that, from the given situation, 70% of the time they won’t.
References
Squad values
[1] Peeters T (2018). Testing the wisdom of crowds in the field: Transfermarkt valuations and international soccer results. International Journal of Forecasting, 34(1), 17–29. https://doi.org/10.1016/j.ijforecast.2017.08.002
Modelling matches
[2] Maher MJ (1982). Modelling association football scores. Statistica Neerlandica, 36(3), 109–118. https://doi.org/10.1111/j.1467-9574.1982.tb00782.x
[3] Dixon MJ, Coles SG (1997). Modelling association football scores and inefficiencies in the football betting market. Journal of the Royal Statistical Society: Series C (Applied Statistics), 46(2), 265–280. https://doi.org/10.1111/1467-9876.00065
[4] Hvattum LM, Arntzen H (2010). Using ELO ratings for match result prediction in association football. International Journal of Forecasting, 26(3), 460–470. https://doi.org/10.1016/j.ijforecast.2009.10.002
[5] Constantinou AC, Fenton NE (2012). Solving the problem of inadequate scoring rules for assessing probabilistic football forecast models. Journal of Quantitative Analysis in Sports, 8(1). https://doi.org/10.1515/1559-0410.1418
Simulating seasons
[6] FiveThirtyEight (2017). How our club soccer predictions work. FiveThirtyEight. https://fivethirtyeight.com/features/how-our-club-soccer-predictions-work/
FiveThirtyEight closed in 2025, so this page may only be available through web archives.
Appendix A: the ratings in detail
Attack and defence: for each match, the home side’s expected goals are exp(μ + home + attack[home] − defence[away]) and the away side’s are exp(μ + attack[away] − defence[home]). We find the ratings that best fit each side’s blended goals (70% xG, 30% goals) across every previous league match, weighting each match by 0.5 to the power of (rounds ago ÷ 20). Each team’s ratings are pulled gently towards a starting point predicted from its squad value: its log Transfermarkt value relative to the league average, multiplied by a slope that is estimated in the same fit. The pull is worth about five matches of evidence, so it matters early on and fades as matches arrive. Because xG leaves out own goals, the overall level of goals is then set from actual goals.
Expected Points rating: a running average of 0.85 × xPts + 0.15 × points per game, where each previous game’s weight is multiplied by 0.93 after every match (so it halves every ten games). Each season starts with six ‘pretend’ games at a value predicted from squad value, using how squad value has related to points in earlier seasons. The rating is turned into expected goals with a fitted relationship.
The blend averages the two on the scale of log expected goals, which makes each match’s expected goals the geometric mean of the two. Match probabilities use a Dixon–Coles adjustment with ρ = −0.05. In the simulations, the nudge after each simulated match is half of a one-match update to each team’s attack and defence.
Appendix B: testing against the market
We used FotMob for results and xG from 2020/21, the first Scottish Premiership season with public shot-level xG, and closing odds from football-data.co.uk. Pinnacle’s odds stop part way through 2025/26, so Betfair Exchange closing prices stand in after that; where both exist (872 matches), they score almost identically (0.1979 for Betfair against 0.1982 for Pinnacle). 2020/21 only warmed the ratings up, and every forecast from 2021/22 onwards was scored. We ran the same tests on the Premier League, and the patterns held.
Most choices were tested by tuning on all seasons but one and scoring the season left out. The final blend’s settings were picked from those results, so its score may flatter it slightly.
The graph below shows how the blend of Expected and Actual Goals, and the speed of forgetting, affect the score. Anything from 70% to 85% expected was close to the best; leaning entirely on Actual Goals, or forgetting too quickly, was clearly worse.
Appendix C: testing the season simulations
We ran the simulations from nine points in each season from 2021/22 to 2025/26 (before a ball was kicked, then after 5, 10, 15, 20, 25, 30, 33, and 35 rounds), 4,000 times each, and scored them against the final table: how much probability they put near each team’s actual finishing position, and how often final points fell inside the 80% range.
Letting ratings move helped in almost every version we tried. The size of the nudge mattered less: half a match’s worth of update and a full match’s worth scored about the same, with half closer to the right range width, so we use half.
Simulating the split properly mattered a lot. Fixing the halves in advance from the expected table made forecasts made before the split much worse:
Simpler projections were close on points but not on anything else. ‘Points so far plus games left times points per game’, built on the Expected Points rating, came within 0.1 points per team of the simulations’ average error in the Premier League, but was 0.25 points worse in the Scottish Premiership, where the split and the uneven fixture list skew things. Its ranges were far too narrow: final points landed inside its 80% range only 65–75% of the time.
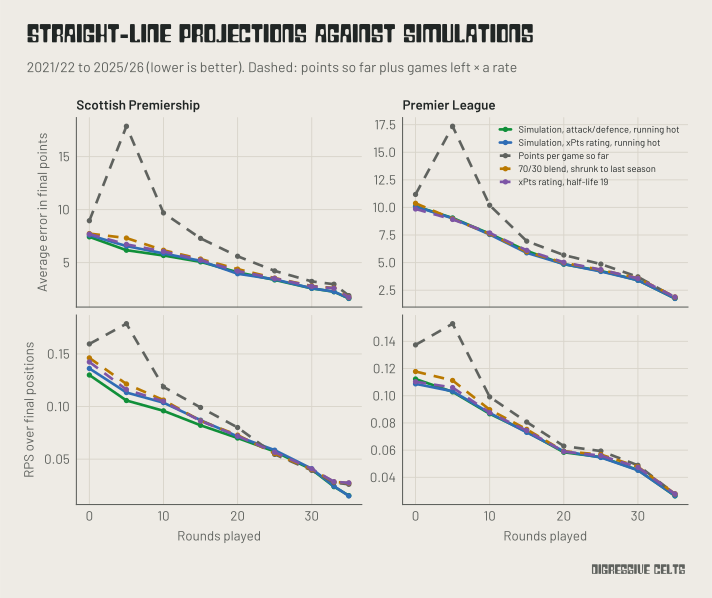
Season outcomes were well calibrated with ratings running hot: title, top-place, and relegation chances happened about as often as forecast. With fixed ratings, the favourites were too often given near-certainty.
Appendix D: the start of the season
The start of the season is the hardest part. With the attack and defence ratings alone, our match predictions were about twice as far behind the market in the first five rounds as later on, mostly because of promoted teams and summer changes. Three things helped: squad values as the starting point (a small improvement in the Scottish Premiership, and a clear one for promoted teams in the Premier League), the faster Expected Points rating, and blending the two. Pulling every team more firmly towards average made things worse.
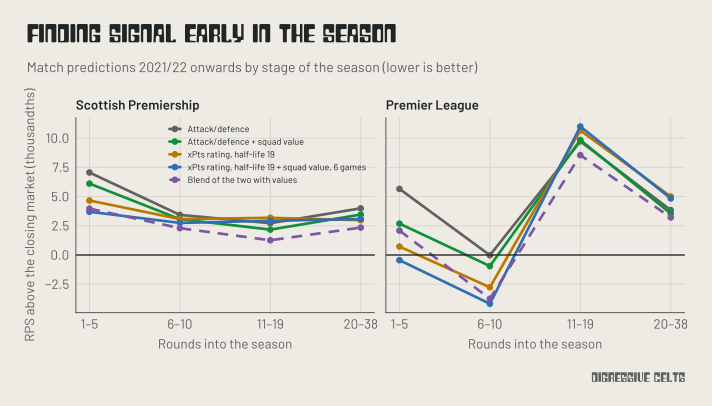
We also tried blends whose weights change through the season, starting mostly with the Expected Points rating and squad values and moving towards the attack and defence ratings. The best-fitting version did exactly that, but tested on seasons it hadn’t been fitted on, it was no better than an even split, so we kept it simple.